About
Gonzaga’s Jesuit, Catholic, Humanistic education will challenge and inspire you.
Gonzaga’s Jesuit, Catholic, Humanistic education will challenge and inspire you.
Gonzaga offers 16 undergraduate degrees through 53 majors, 68 minors and 73 concentrations, 23 master’s degrees and 5 doctoral-level degrees.
All the how-to's and why-you-should's for becoming a Zag.
The Division of Student Affairs is committed to creating an academically rich environment and fostering a strong sense of community.
The Gonzaga spirit, blended with hard work and dedication in athletic endeavors, yields success both on the field of play and in the classroom.
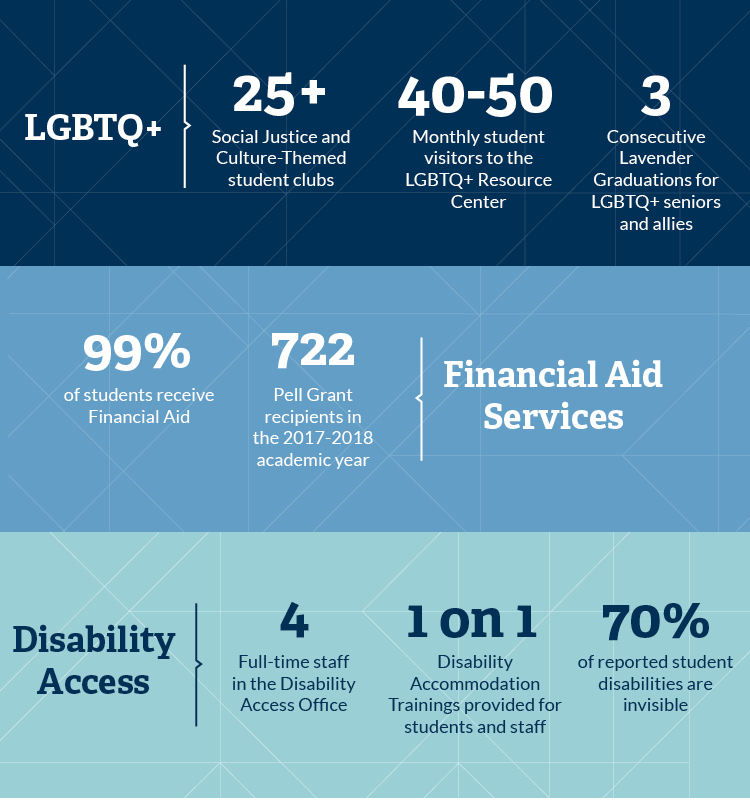
Numbers cannot tell the whole story of who we are. They can, however, give us a snapshot of our current student body, staff, and faculty and the resources made available to them. Consider these figures a baseline—a place to start—in our ongoing efforts to create a more inclusive campus community.

