2024 Employment Statistics
ABA Report on Gonzaga's 2024 Employment (PDF)
2023 Employment Statistics
ABA Report on Gonzaga's 2023 Employment (PDF)
2022 Employment Statistics
ABA Report on Gonzaga's 2022 Employment (PDF)
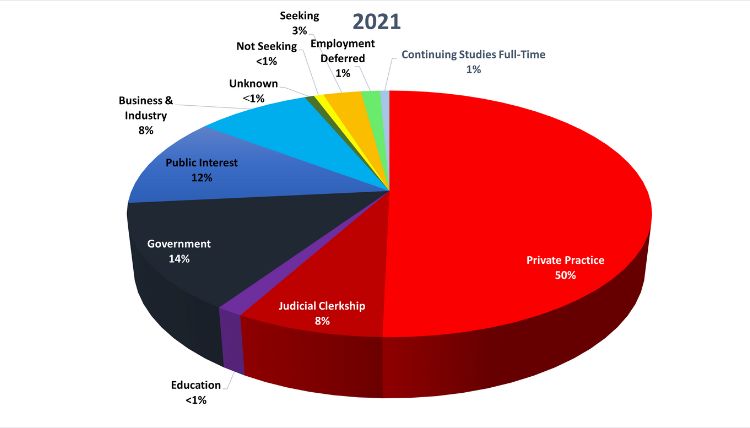
2021 Employment Statistics
ABA Report on Gonzaga's 2021 Employment (PDF)
NALP Report on Gonzaga's 2021 Employment (PDF)
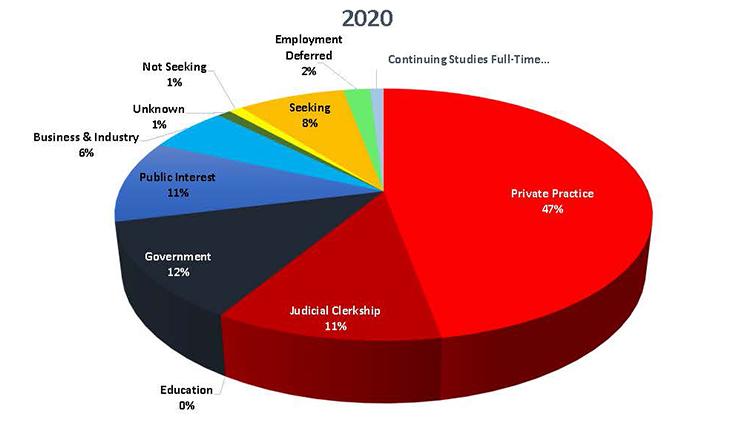
2020 Employment Statistics
ABA Report on Gonzaga's 2020 Employment (PDF)
*Information on employment outcomes for the Class of 2020 may not reflect a particular law school’s typical results in this area. As a result of the COVID-19 pandemic, bar admission exams were canceled or delayed in many jurisdictions, thus making it more challenging for graduates to secure employment by the annual Graduate Employment Status Date of March 15. Please reference the 3 years of employment outcome data posted on the ABA Required Disclosures webpage of each ABA-Approved Law School or at www.abarequireddisclosures.org.
NALP Report on Gonzaga's 2020 Employment (PDF)
*Per Interpretation 509-2 of Standard 509, law schools may choose to publicize additional employment outcome data beyond what the Employment Protocols require. This additional data, per Standard 509, must be “complete, accurate, and not misleading to a reasonable law school student or applicant.” Law schools are expected to use “due diligence in obtaining and verifying such information.” The following additional employment outcome data has not been, and will not be, audited by the ABA. It is meant to supplement the annual ABA Employment Summary Report, which reflects the employment status of members of each graduating class as of the annual Graduate Employment Status Date of March 15. Please reference the 3 years of employment outcome data posted on the ABA Required Disclosures webpage of each ABA-Approved Law School or at www.abarequireddisclosures.org
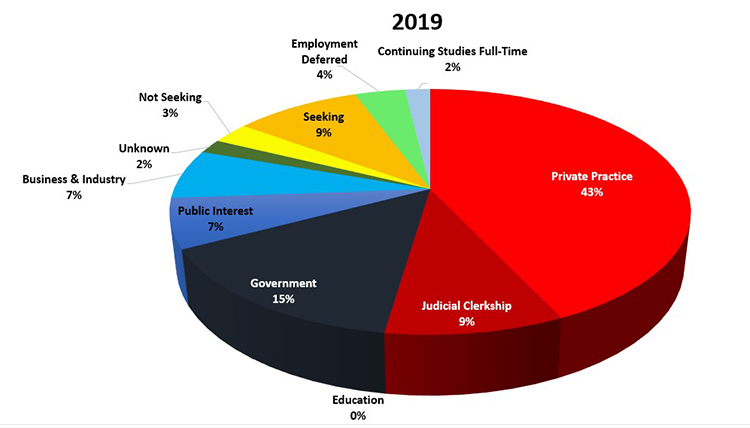
2019 Employment Statistics
Of the 107 graduates of the Class of 2019, over 80% were employed as of the ABA report date of March 16, 2020. Four additional graduates secured employment that started after March 16, 2020, two were seeking additional degrees, and three were not seeking employment. Of those employed, 85 were in bar passage required or JD advantage careers.
ABA Report on Gonzaga's 2019 Employment (PDF)
NALP Report on Gonzaga's 2019 Employment (PDF)
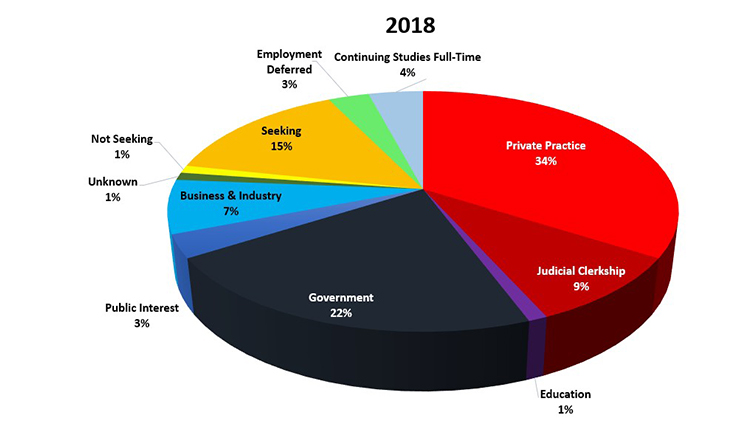
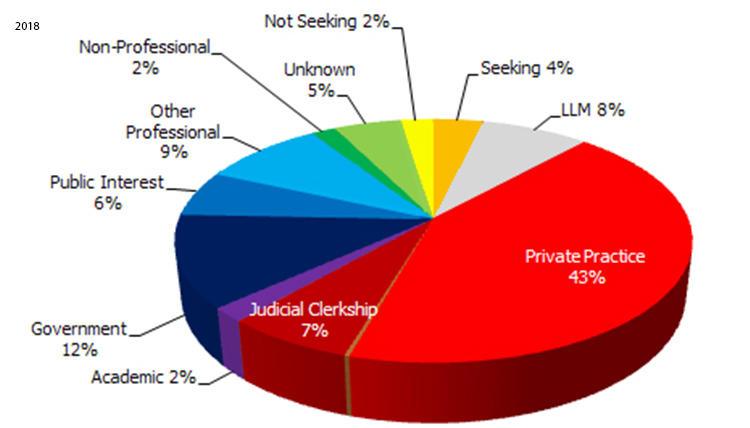
2018 Employment Statistics
Of the 97 graduates of the Class of 2018, 76.3% were employed as of the ABA report date of March 15, 2019. Three additional graduates received full-time offers after March 15, four were pursuing additional degrees, and one was not seeking employment. Of those employed, 71 were in bar passage required or JD advantage careers.
ABA Report on Gonzaga's 2018 Employment (PDF)
Download the NALP Report on Gonzaga's 2018 Employment (PDF)
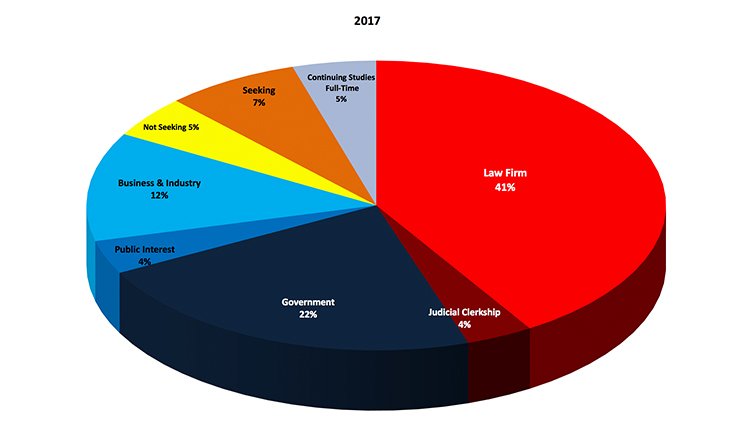
2017 Employment Statistics
Of the 107 graduates of the Class of 2017, 83% were employed as of the ABA report date of March 15, 2018. Five graduates were seeking additional degrees, and five were not seeking employment. Of those employed, 82 were in bar passage required or JD advantage careers.
ABA Report on Gonzaga's 2017 Employment (PDF)
Download the NALP Report on Gonzaga's 2017 Employment (PDF)
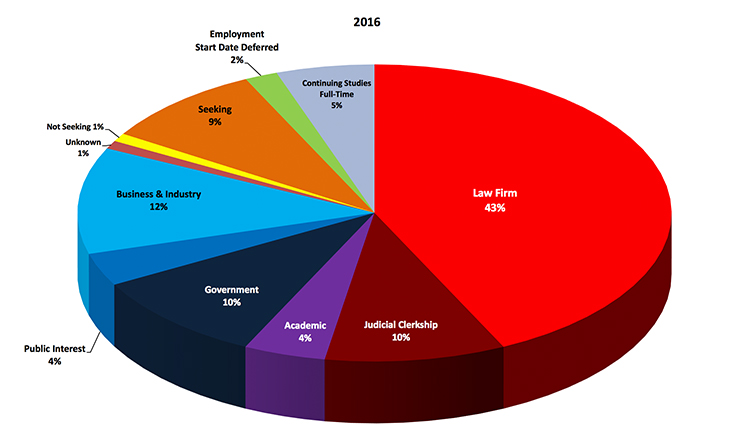
2016 Employment Statistics
Of the 112 graduates of the Class of 2016, 92 were employed as of March 15, 2017. Additionally, two graduates secured employment that started after March 15, 2017, six were pursuing additional education, and one was not seeking employment. Of those employed, 85 are in bar passage required or JD advantage positions.
ABA Report on Gonzaga’s 2016 Employment (PDF)
Download the NALP Report on Gonzaga’s 2016 Employment (PDF)
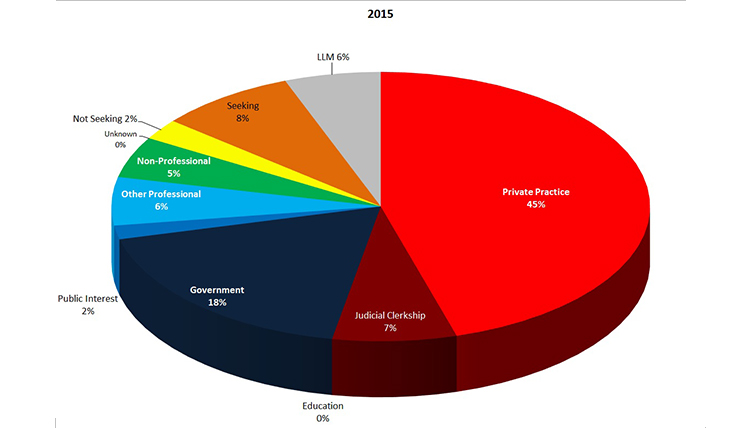
2015 Employment Statistics
Of the 121 graduates in the Class of 2015, 101 secured employment as of March 15, 2016. Additionally, seven graduates enrolled in a graduate degree and three graduates were not seeking employment. Of those employed, 94 are in bar passage required or JD advantage positions.ABA Report on Gonzaga’s 2015 Employment (PDF)
Download the NALP Report on Gonzaga's 2015 Employment (PDF)
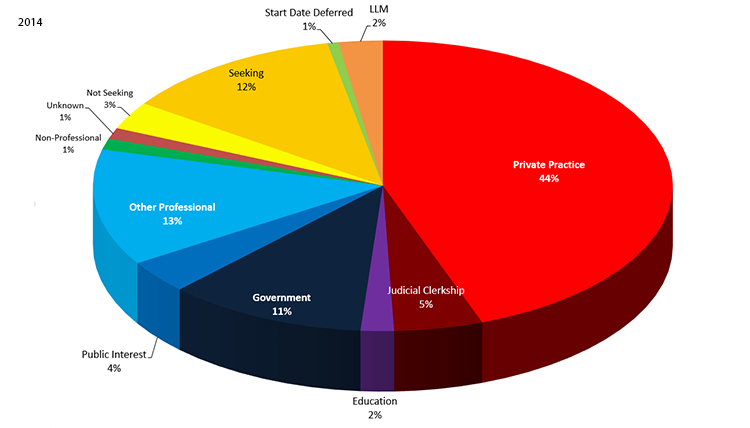
2014 Employment Statistics
Of the 162 graduates in the Class of 2014, 151 reported seeking post-graduate work. Of the 151 seeking work, 130 secured employment as of March 15, 2015. 121 of those employed as of that date are in bar passage required or JD advantage positions. Since the March 15 report date, an additional 3 graduates secured bar passage required positions as of April 7, 2015.
ABA Report on Gonzaga Law's 2014 Employment (PDF)
NALP Report on Gonzaga Law’s 2014 Employment (PDF)
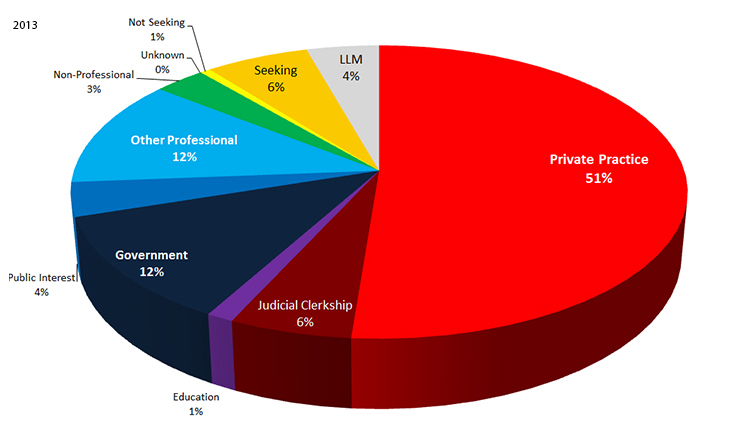
2013 Employment Statistics
Of the 161 graduates in the Class of 2013, 153 reported seeking post-graduate work. Of the 153 seeking work, 142 secured employment as of February 15, 2014. 132 of those employed as of that date are in bar passage required or JD advantage positions. Seven of those not seeking work are enrolled in full-time graduate degree programs, and one is serving as a full-time volunteer.
ABA Report on Gonzaga’s 2013 Employment* (PDF)
*Though the 2012 report contains percentage figures, the 2013 report provided by the ABA does not.
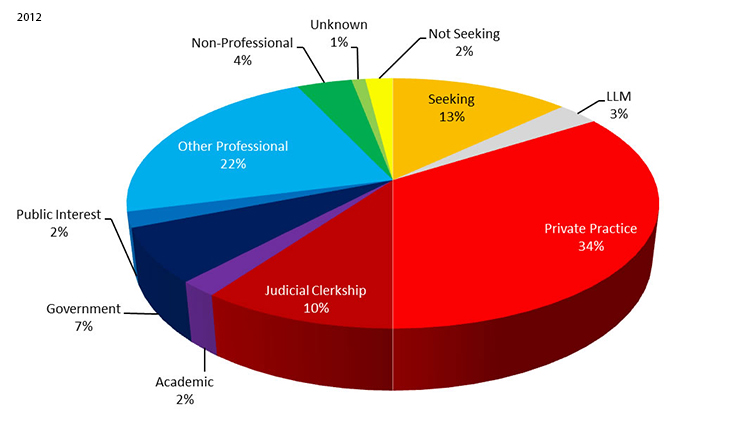
2012 Employment Statistics
Of the 166 graduates in the Class of 2012, 157 reported seeking post-graduate work. Of the 157 seeking work, 133 secured employment as of February 15, 2013. 122 of those employed as of that date are in bar passage required or JD advantage positions. Five of those not seeking work are enrolled in full-time graduate degree programs.ABA Report on Gonzaga’s 2012 Employment (PDF).
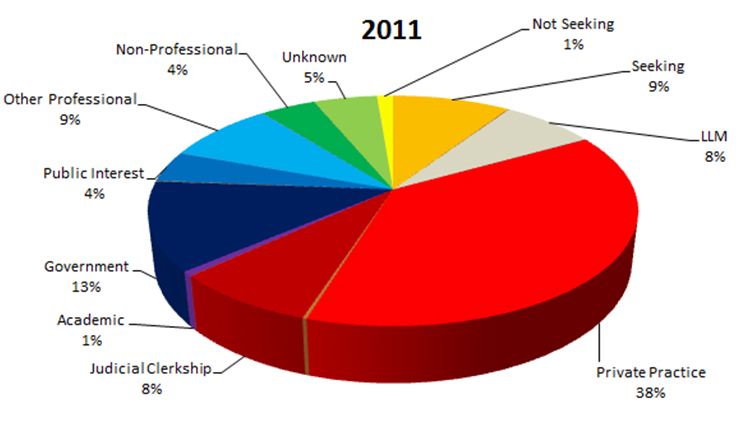
2011 Employment Statistics
Of the 160 graduates in the Class of 2011, 146 reported seeking post-graduate work. Of the 146 seeking work, 123 secured employment as of February 15, 2012. 112 of those employed as of that date are in bar passage required or JD advantage positions. Twelve of those not seeking work are enrolled in full-time degree programs.ABA Report on Gonzaga’s 2011 Employment (PDF).
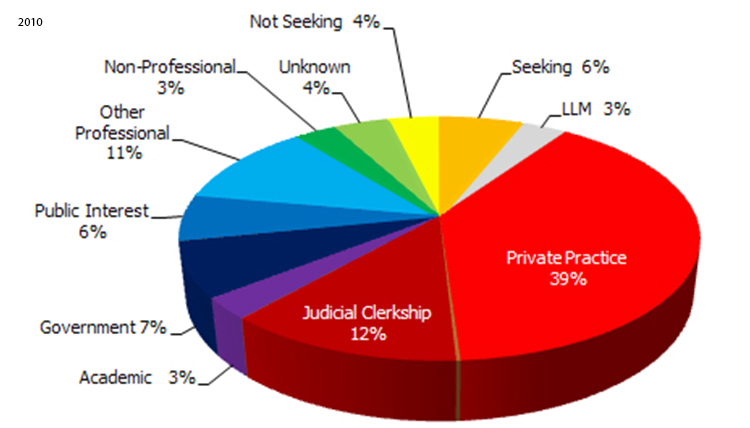
2010 Employment Statistics
Of the 178 graduates in the Class of 2010, 165 reported seeking post-graduate work. Of the 165 seeking, 147 secured employment as of February 15, 2011. 133 of those employed as of that date are in bar passage required or JD preferred positions. Six of those not seeking work are enrolled in full-time degree programs.
ABA Report on Gonzaga’s 2010 Employment (PDF).
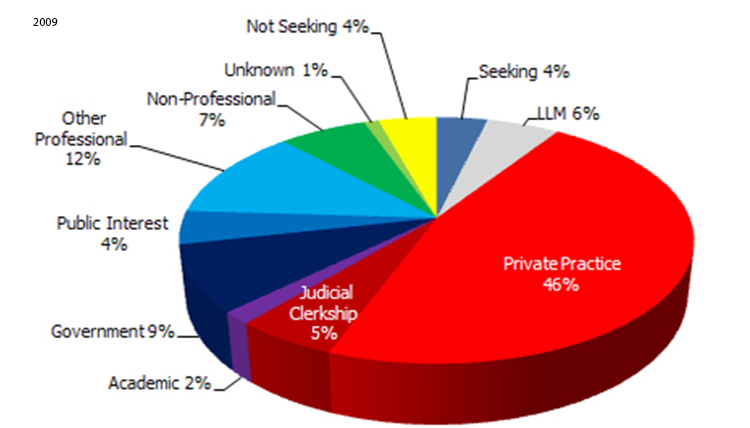
2009 Employment Statistics

